Argus Risk
Every number shows where it came from and how old it is.
Runs locally with one Docker command.
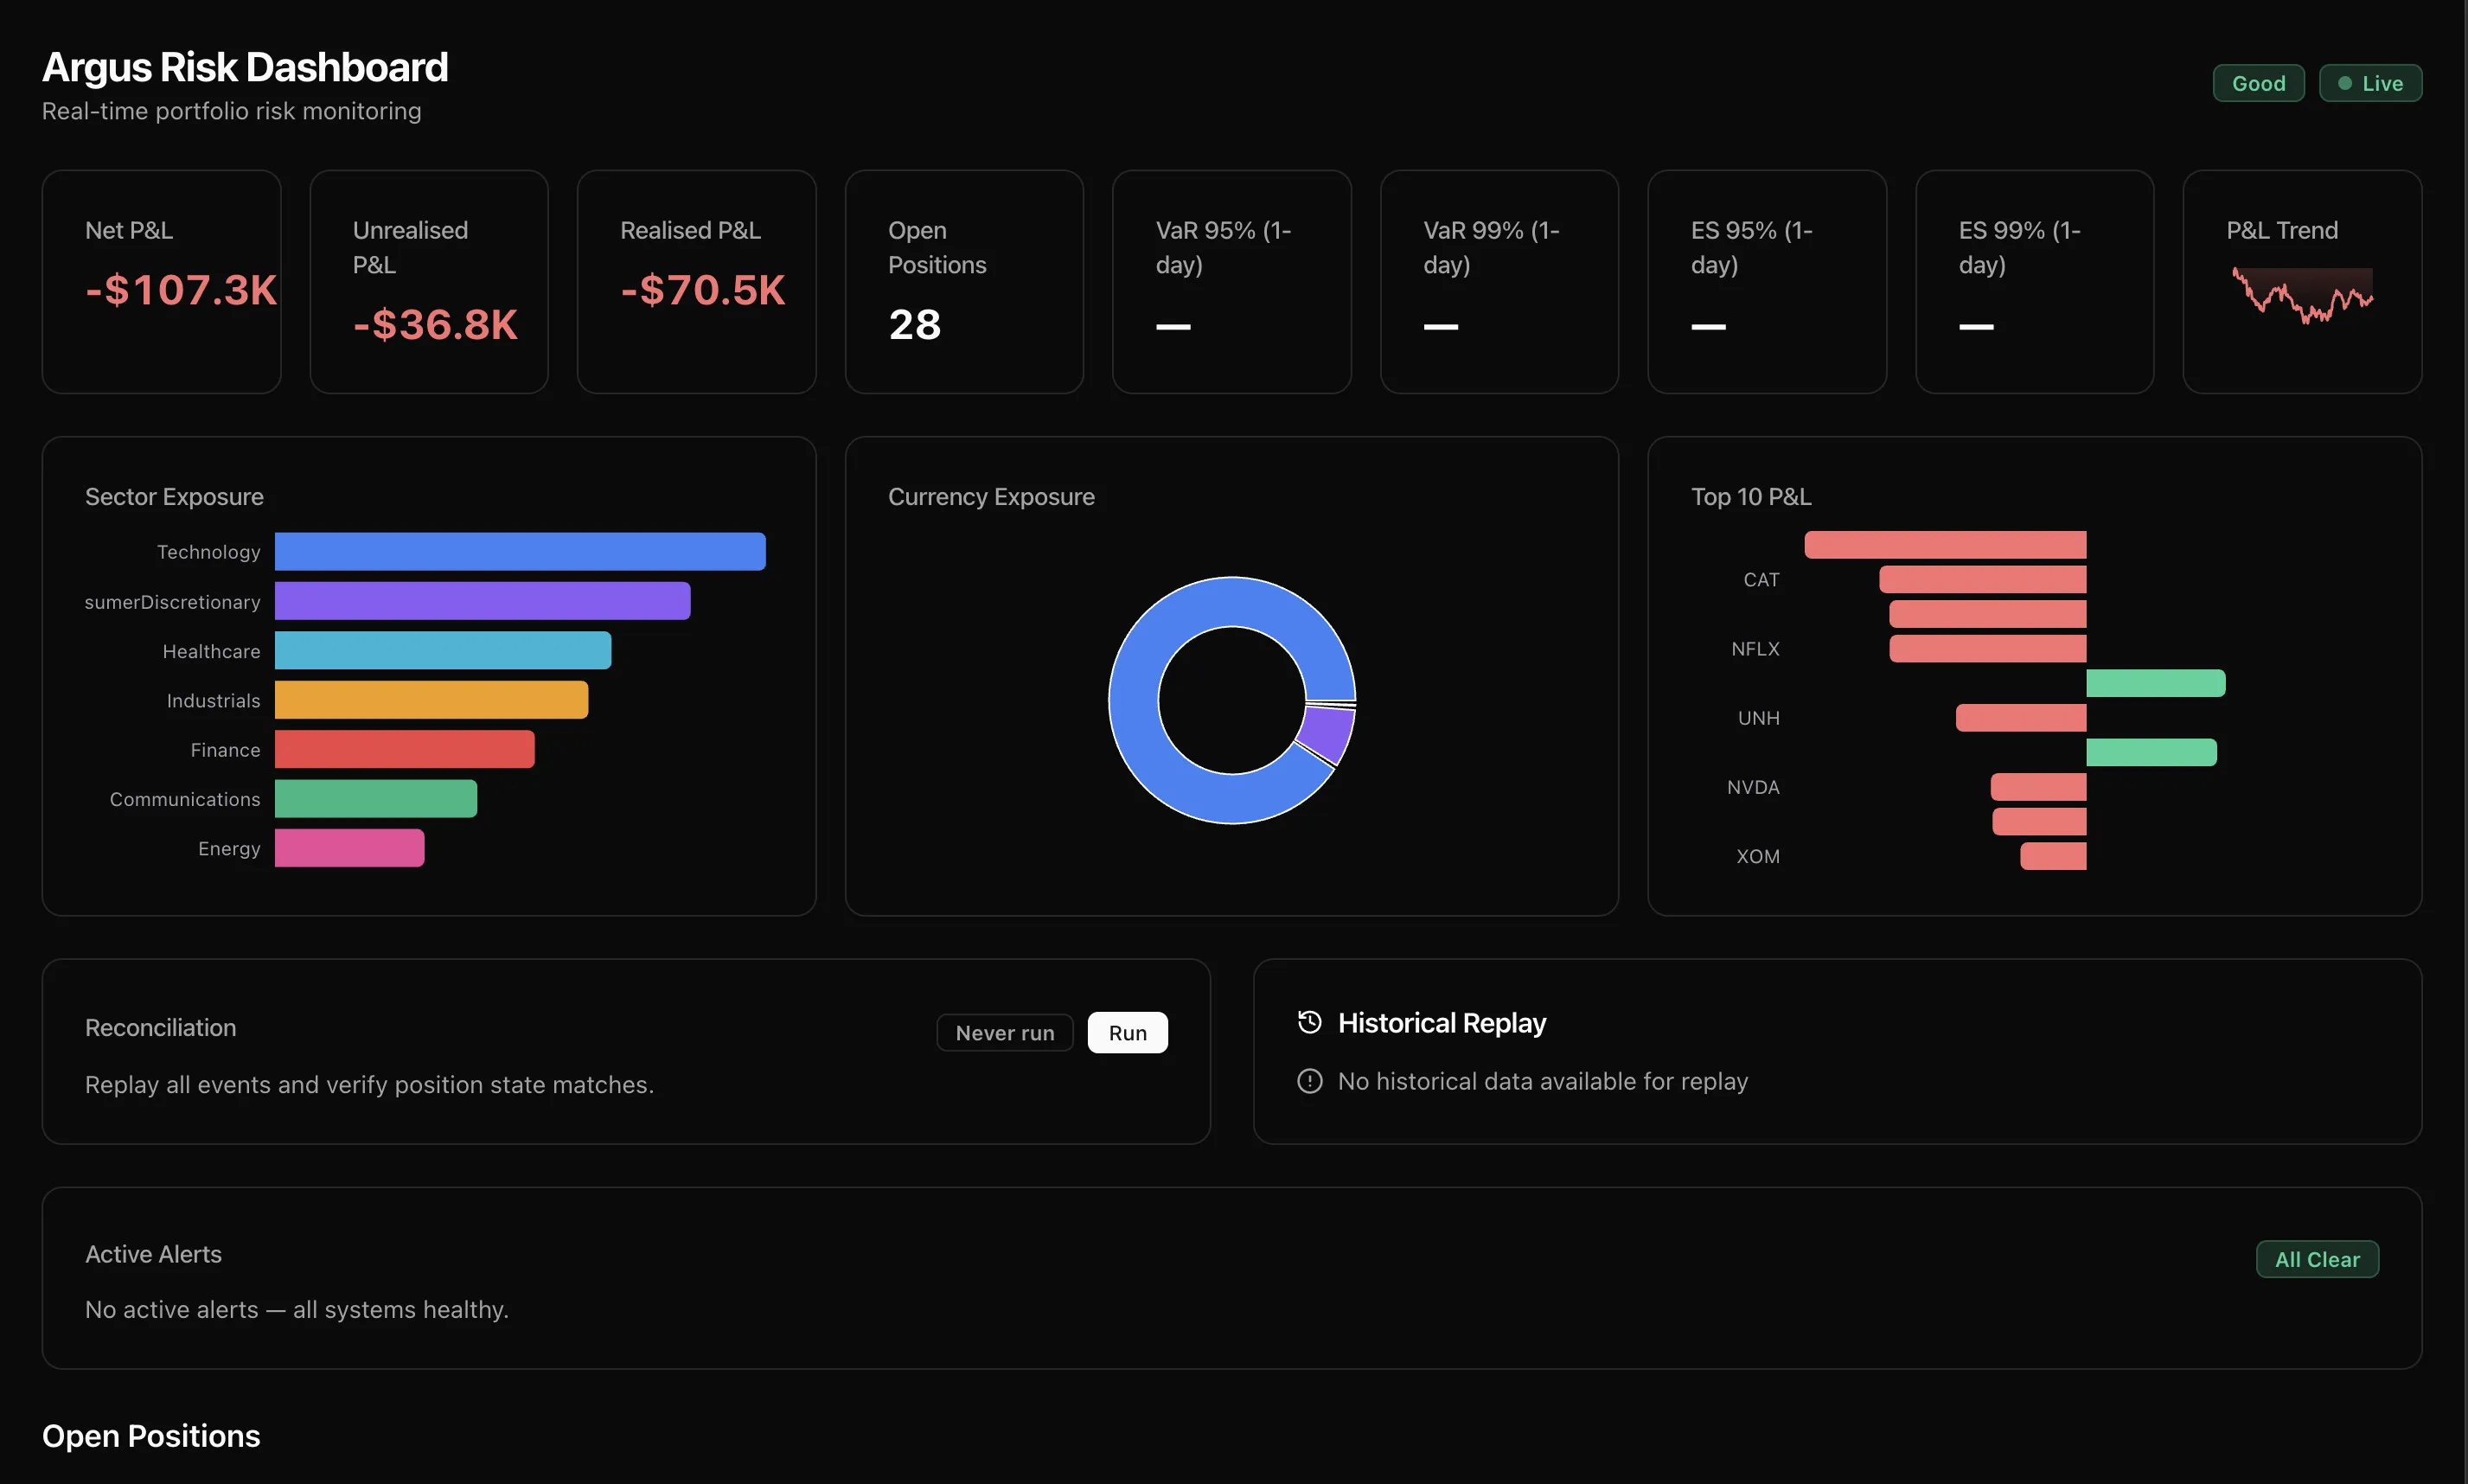
A total doesn’t say how old it is.
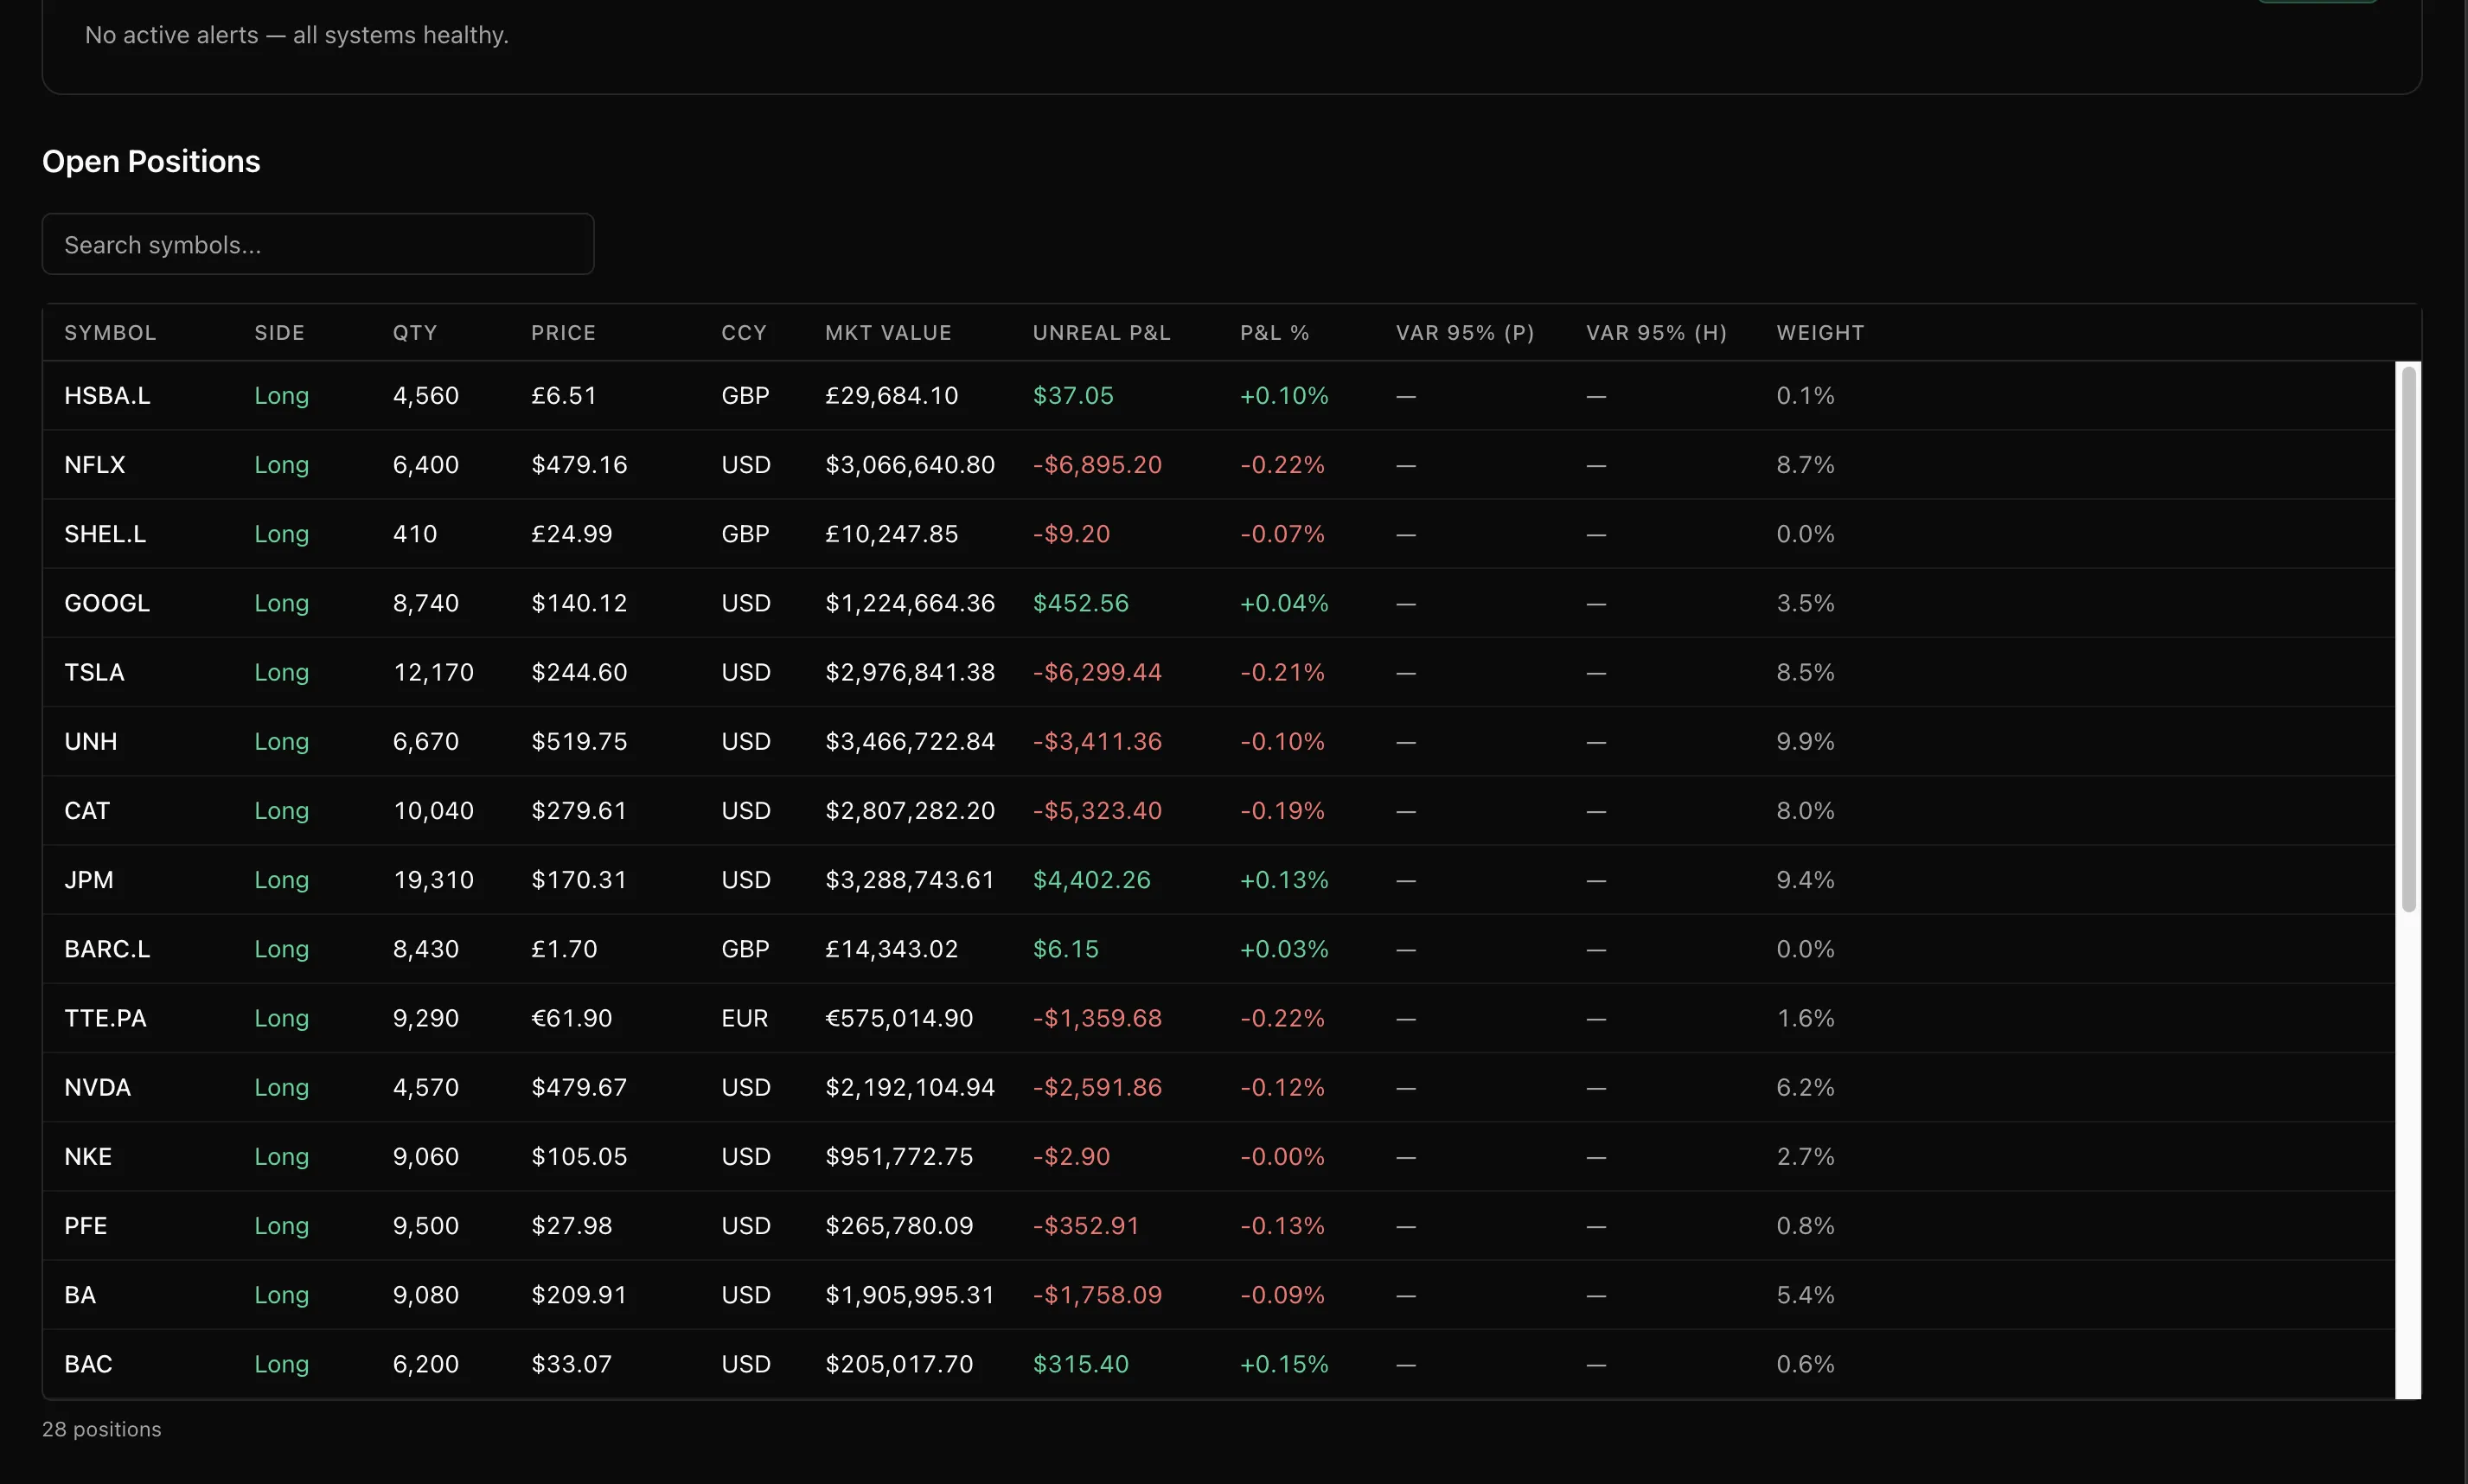
I built this one on purpose. I work on pricing and risk systems, and I wanted to build a small version of that world end to end, with a front end that makes it easy to see. Most risk dashboards show a portfolio’s value, but not how old it is, which feed it came from, or whether the system is keeping up. Argus is a simulator: no real market data, and it runs on your machine.
Two users, on paper.
The spec names the simulated user, a risk or portfolio manager, and the real audience:
hiring managers and engineers at banks, hedge funds, and trading firms
- 5currencies
- 4services
- 126.NET tests
- 1command to run it
Show the number with its history.
- Every change is an event. Replay them and you can see any position at any point in time.
- Freshness sits next to the value. If a feed stalls, you see what failed and how old the number is.
- The maths is plain functions. FIFO cost basis, P&L, and Value at Risk: same inputs, same answer.
- Check the answer. A reconciliation run replays history and compares it with the live state.
Four services and a stream.
Two simulators publish prices, FX rates, and trades to Kafka (Redpanda locally). The risk engine publishes a snapshot every second, and SignalR pushes it to a Next.js dashboard. Marten keeps position events in PostgreSQL, so history replays at up to 60 times speed.
Runs locally, not measured yet.
It only runs locally, so looking at it means cloning the repo. I designed for under 500 ms from a price change to the dashboard, but I haven’t measured it.
What I’d do next
- Measure the latency. Add a benchmark and publish the result.
- Make it easier to see. A recorded replay or a hosted read-only demo.
- Stress testing. Let you shock a currency or a sector and watch the portfolio react.